Every Finance Task, Done Faster
Handle every financial task, from simple reports to complex financial models. Connect your data, select a model, and get results ready to share in minutes.
No credit card required · Free plan available
Inside the App
Your AI-powered financial command center
Every Finance Task
From monthly reporting to compliance checks: dashboards, reports, transforms, analysis, and more. All in one place.
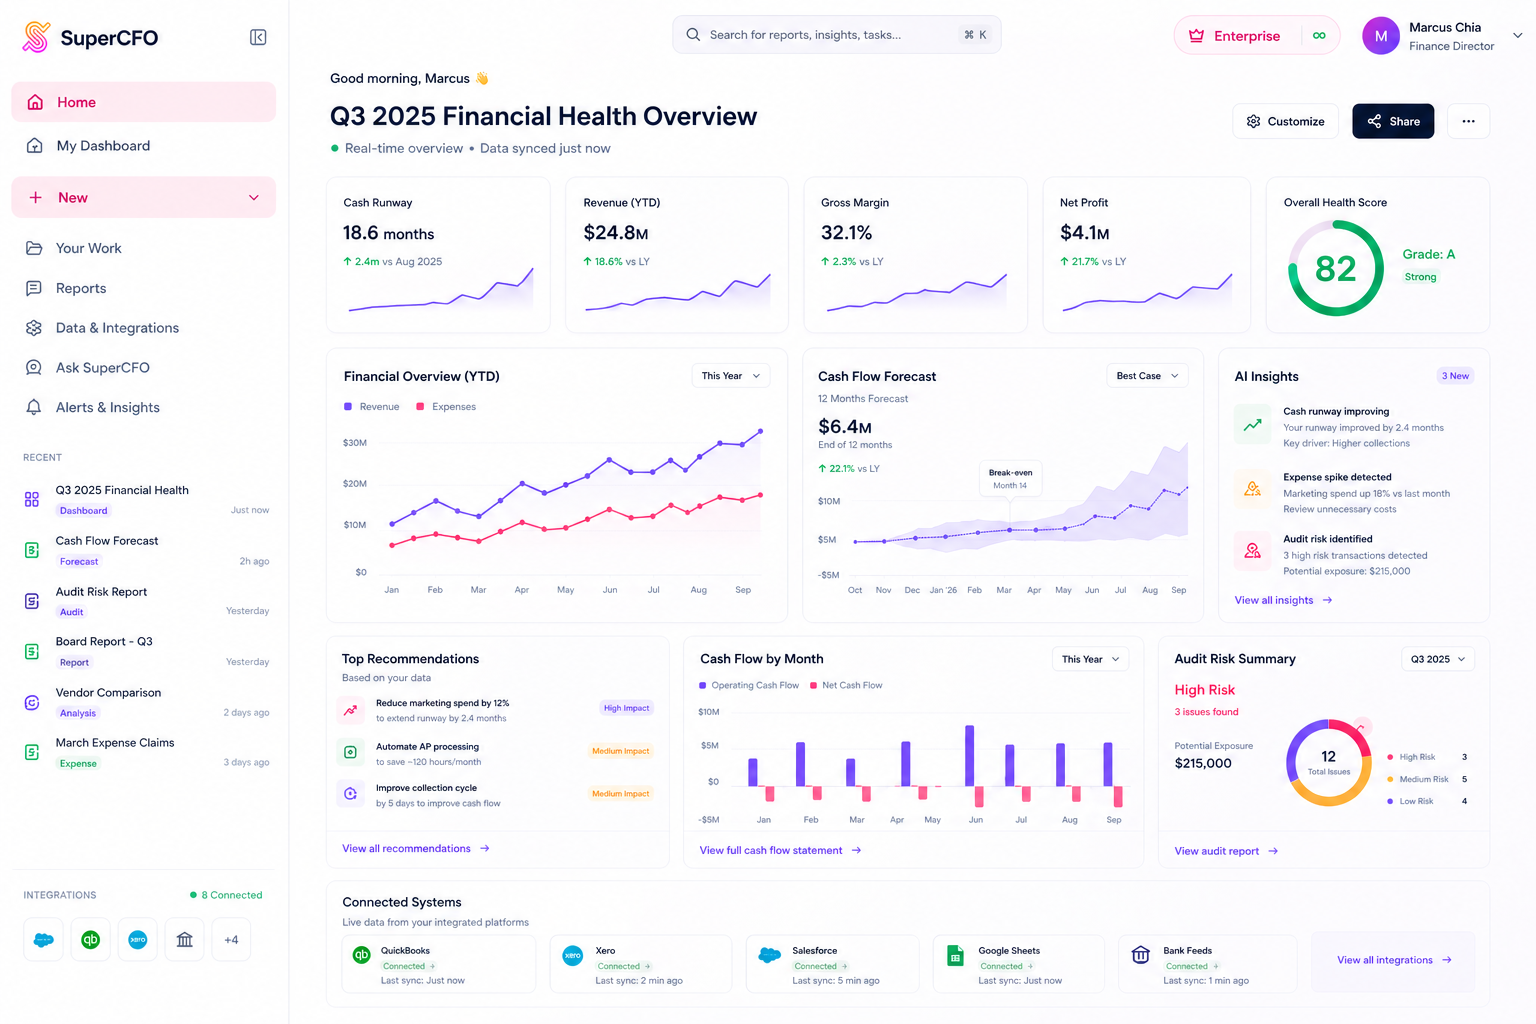
Business Health
99 Speed Mart Retail
9M Ended 30 Sep 2025
Overview
Chapters
Analysis Tools
Executive Summary
High-level business health snapshot
Grade: A
Business Value Indicator
Strong performance
RETURN ON EQUITY (ROE)
24.7%
Strong performance
RETURN ON CAPITAL (ROC)
22.6%
Efficient capital use
CASH CONVERSION CYCLE
−3.5 days
Negative CCC (excellent)
GROSS PROFIT PER RM100
RM 11.58
+0.2% YoY
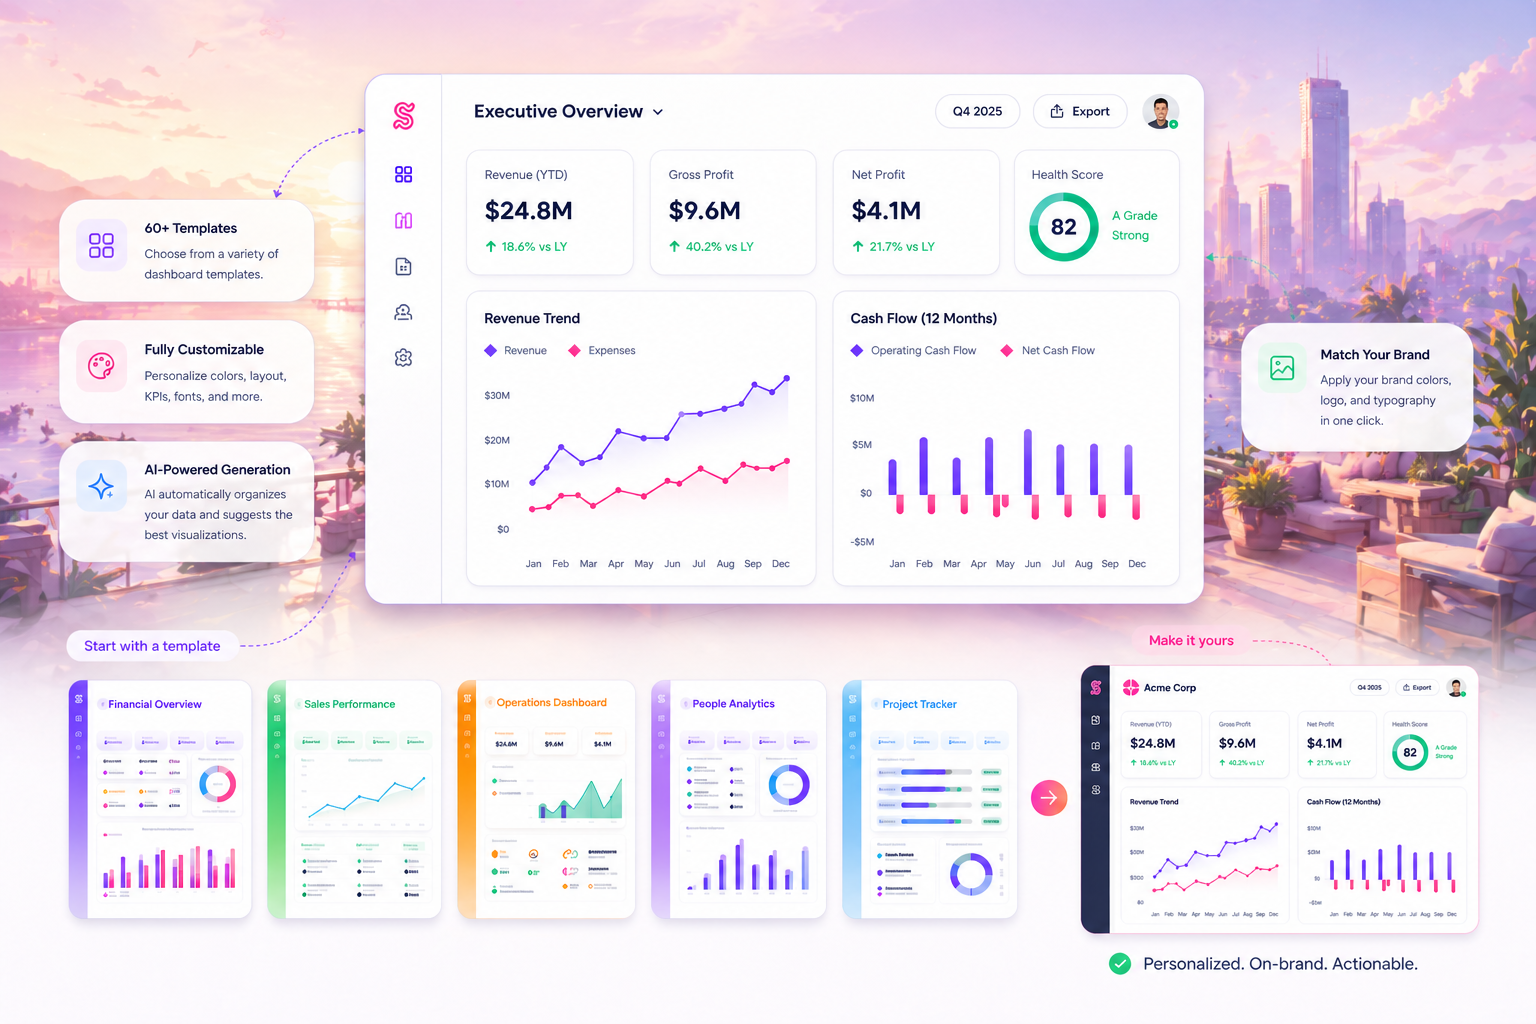
Interactive Dashboards
63+ templates. Upload P&L or management accounts and get a fully interactive HTML dashboard in under 60 seconds.
Instructions: Extract all P&L line items with columns: Account, Q3 2025, Q3 2024, YTD 2025, YTD 2024
Source: 99SMART_Interim_Financial_Report_(2020-Q3).pdf
Extract & Clean Data
Upload messy, inconsistent spreadsheets. Get back clean, structured Excel files formatted exactly how you need.
Expense Claims
Bulk-upload receipts and get back a ZIP with a complete Excel summary and renamed, organised receipt files.
Quotation Comparison
Upload vendor quotations and get a side-by-side Excel analysis with scoring, recommendations, and cost breakdowns.
Instructions:Compare the prior year financial statements (CSV) against the current year Xero data. Identify variances >10%, explain likely causes.
Audit Flag: MODERATE
The composition of this account should be reviewed to ensure that no items have been parked here that belong in more specific categories.
3.9 Accounts with Zero Activity in Current Year
The following accounts recorded expenditure in the prior year but show zero balances in the current year Xero P&L. These require management confirmation:
Audit Flag: HIGH PRIORITY for Entertainment
MYR 1,553.68 YTD in a loss-making entity requires itemised receipts, business purpose documentation, and approval confirmation for each claim.
FS Casting Check
Upload financial statements. SuperCFO verifies mathematical accuracy, cross-references figures, and flags every error.
Scenario — Create a 12-month sales revenue forecast based on current Stripe payment trends and subscription MRR.
Investment & Financial Analysis
DCF valuations, P&L analysis, PE ratios, dividend policy, and scenario models. Provide assumptions and AI builds the model.
Report Compilation
Generate IFRS, MPERS, or interim financial reports from your data. Structured, compliant, and ready for review.
Instructions:Analyze my Stripe SaaS business. What's my MRR, average revenue per customer, refund rate, and Stripe fee impact?
5. Diversify the Customer Revenue Base
Summary Scorecard
This memo was prepared based on Stripe API data extracted on 19 March 2026. All figures are in Malaysian Ringgit (MYR).
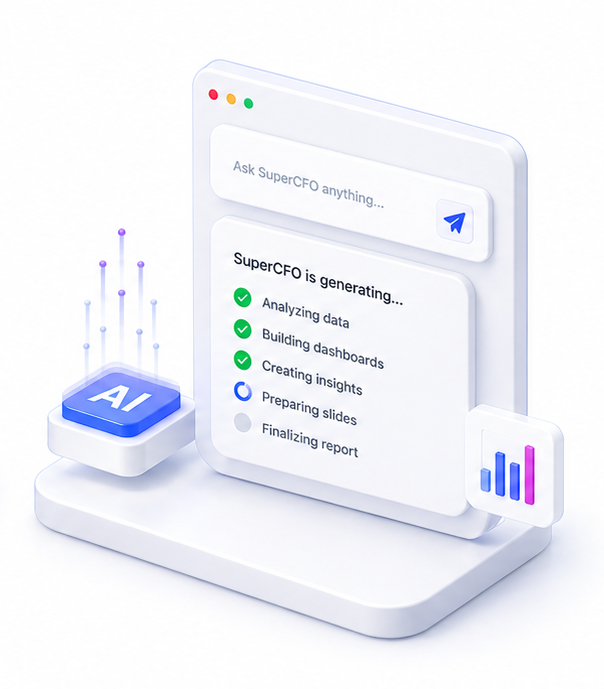
Ask SuperCFO
Your general finance assistant. Ask any finance question, attach supporting files, and get a structured answer or output file.
How SuperCFO Works
From messy data to confident decisions
Handle every financial task, from simple reports to complex financial models. Connect your data, select a model, and get results ready to share.
Connect your data
Upload your files or connect your existing accounting and ERP systems in seconds.
- Sync accounting & ERP systems
- Import spreadsheets, PDFs & bank data
- Live, secure, and always up-to-date
Select a financial model
Choose from dashboards, reports, variance analysis, DCF models, and more. Built with advanced financial models.
- Dashboards, reports & board decks
- DCF, variance & scenario models
- No prompting expertise required
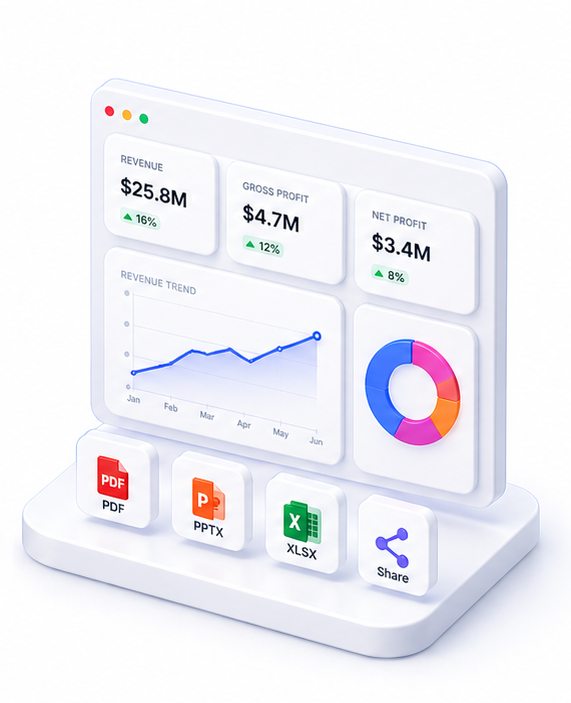
Get results ready to share
Review your complete financial output and export or share it with your team instantly.
- Board-ready outputs & AI insights
- Export as PDF, Excel & more
- Share with your team instantly
Your Financial Data, Protected
Upload, analyse, and export with confidence. Your source files are never stored. Only the reports you save stay with us.
Enterprise AI Models
We use enterprise-tier AI. Your data is never used for training, stored, or shared beyond your session.
Your API Key, Your Control
Connect your own OpenAI, Anthropic, or Google key. Your data flows directly to the provider. We never see or log the raw traffic.
Full Delete Control
Remove individual reports or your entire account in one click. Fully GDPR-compliant.
FAQ

One platform. Every finance use case.
Automate. Analyze. Act. All in one intelligent platform.